

Usually when we think about an estimate, we think about a single number. For example, 100 man-days or 100 story points. However, for uncertain estimates, this could raise more questions. For example, is it a positive outcome or negative outcome? What is the precision behind it? In this article, let’s go over some theories and ways to account for risk in estimates.
Start with Ranges
For the sake of analysis, it’s convenient to regard estimates as a range of outcomes rather than a specific value. In his book Software Estimation, Steve McConnel, a well-known industry author, presented a diagram called “Cone of Uncertainty.” This diagram features how the range of possible software cost/size estimates shrinks as a project progresses through its lifecycle.
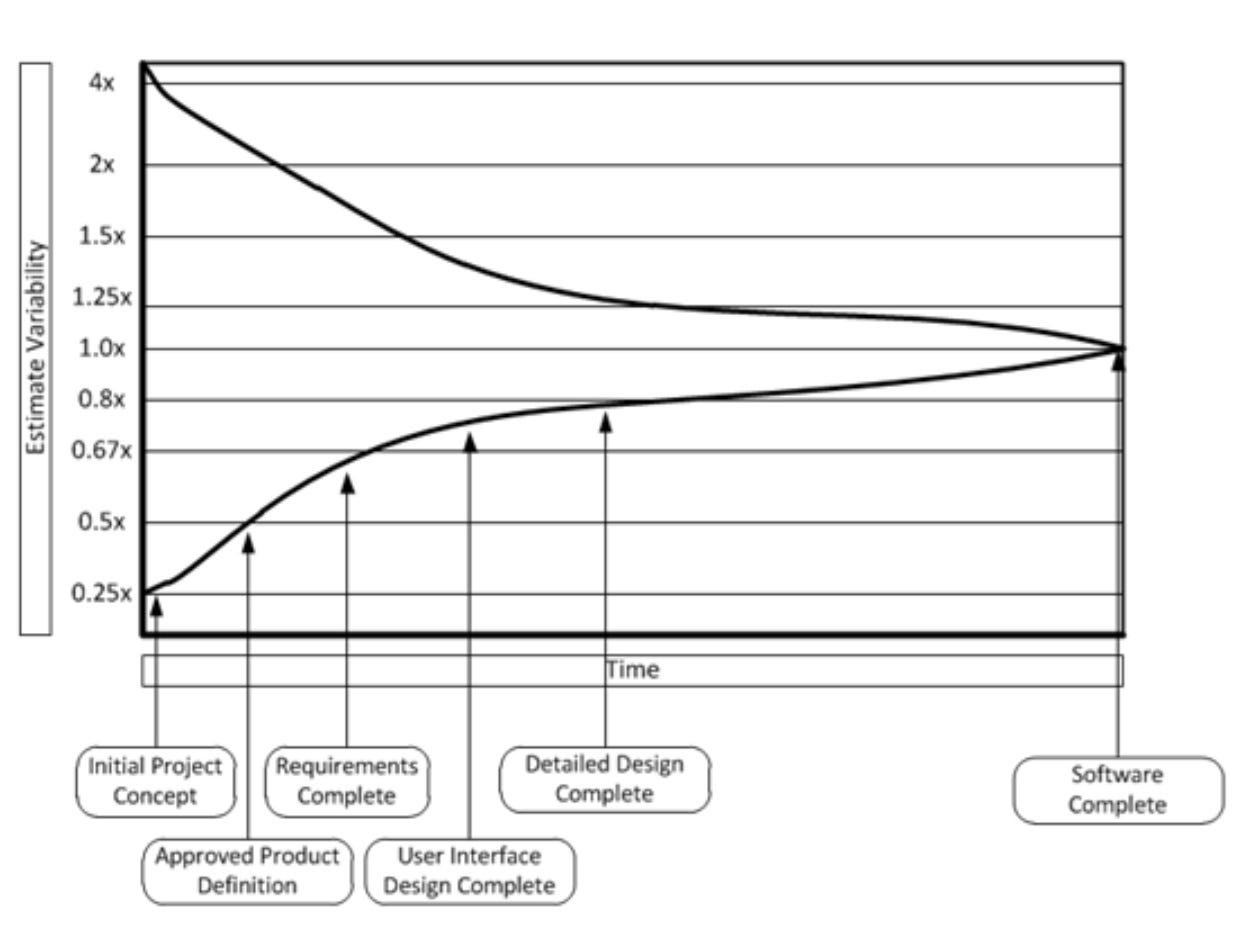
The idea is simple. At the very beginning, the cone is wide, indicating a high level of uncertainty. At this stage, many factors can affect the final outcome. Implementation possibilities, technological limitations, and changes in client requirements create significant “noise” around the project. Over time, as requirements are refined and tasks clarified, the cone begins to narrow. Initial uncertainty is replaced by clearer expectations and a better understanding of the final product. As the project approaches completion, the level of uncertainty becomes minimal, and teams can confidently estimate costs and timelines.
Let’s review an example. Suppose we have a project with just a single line as a requirement. Let’s say “Implement a Payment Gateway solution.” In the beginning, the vast number of the requirements are not clear (e.g., what this gateway will be used for, which payment methods it will support, what interfaces are the most important for the end user). We can identify this stage as “Initial Project Concept.”
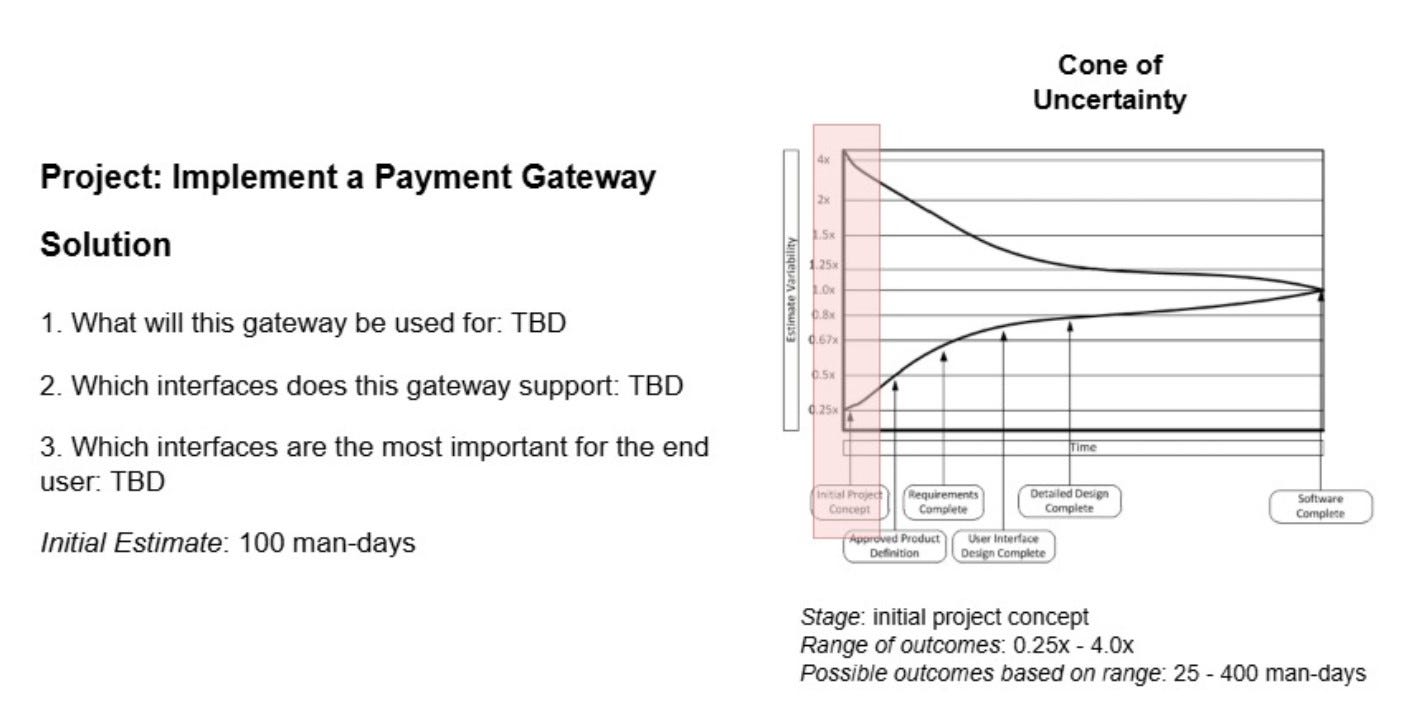
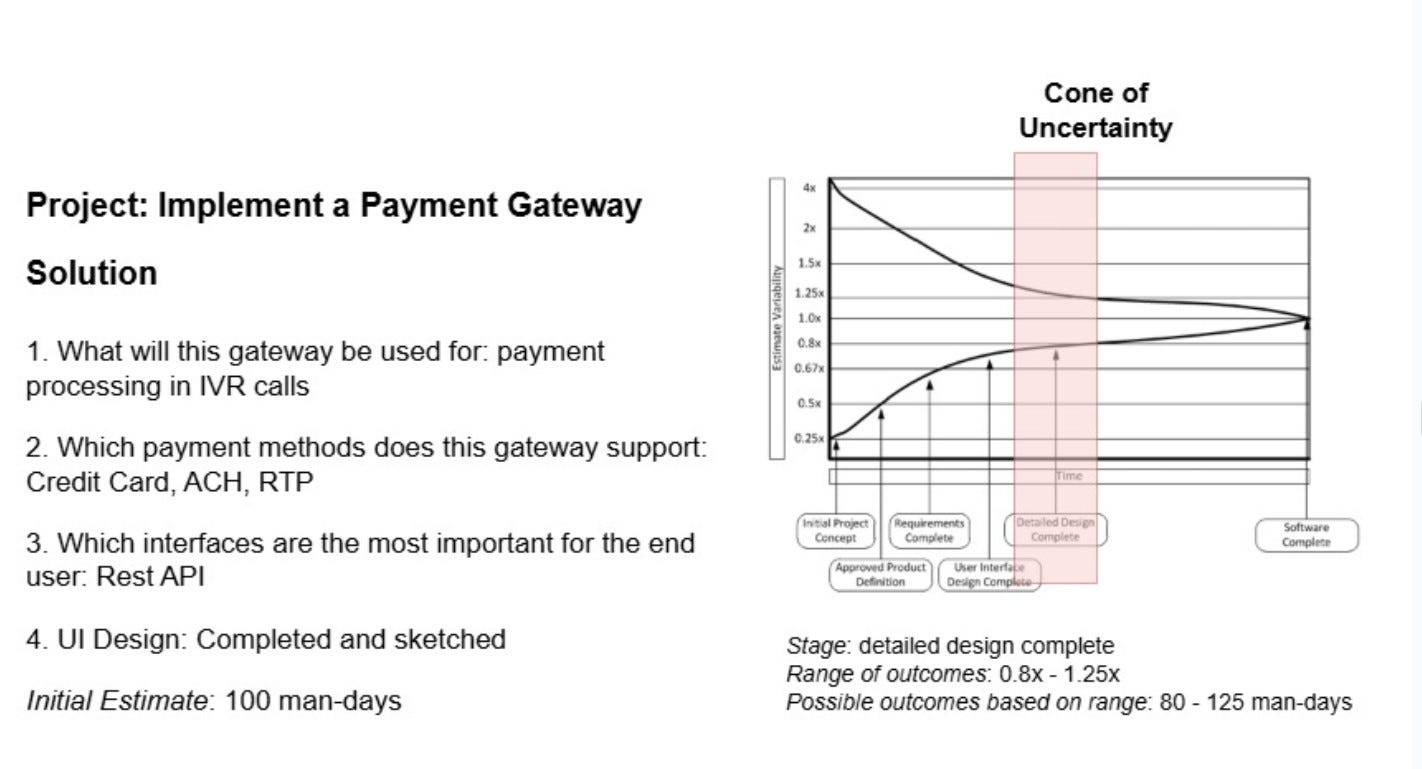
Statistically, according to the cone of uncertainty, an estimate for this stage will have a range of outcomes anywhere from 0.25x to 4.0x. In practice, this means that if the project is given an estimate of 100 days, based on historical data, the possible outcomes can be anywhere from 25 days (being the most positive outcome) to 400 days (being the most negative outcome). With time, as product teams perform work that clarifies specifications and defines clear UI design, this estimate becomes clearer, too. Once the most basic questions about functionality are answered and the initial design sketch for UI is finished, the estimate can be further narrowed down to the slot in the cone that corresponds to the range of 0.8x to 1.25x. In the example of 100 man-days for the baseline, it will mean 80 to 125 days for potential outcomes.
Calculate a Risk-Adjusted Estimate by Using Standard Deviation
While it may be very representative to use an estimate range for presenting estimates, it is still often much more convenient to use a single number based on the given range and so-called risk appetite. Risk appetite is the amount of risk an organization can take to achieve their objectives. In this case, project goals. It is smart in general to select a reasonable expectation rather than bet on high risk; however, in some situations, such as when the project team is quite experienced, one may pick a higher risk.
It is convenient to calculate a risk-adjusted estimate by using standard deviation formulas.
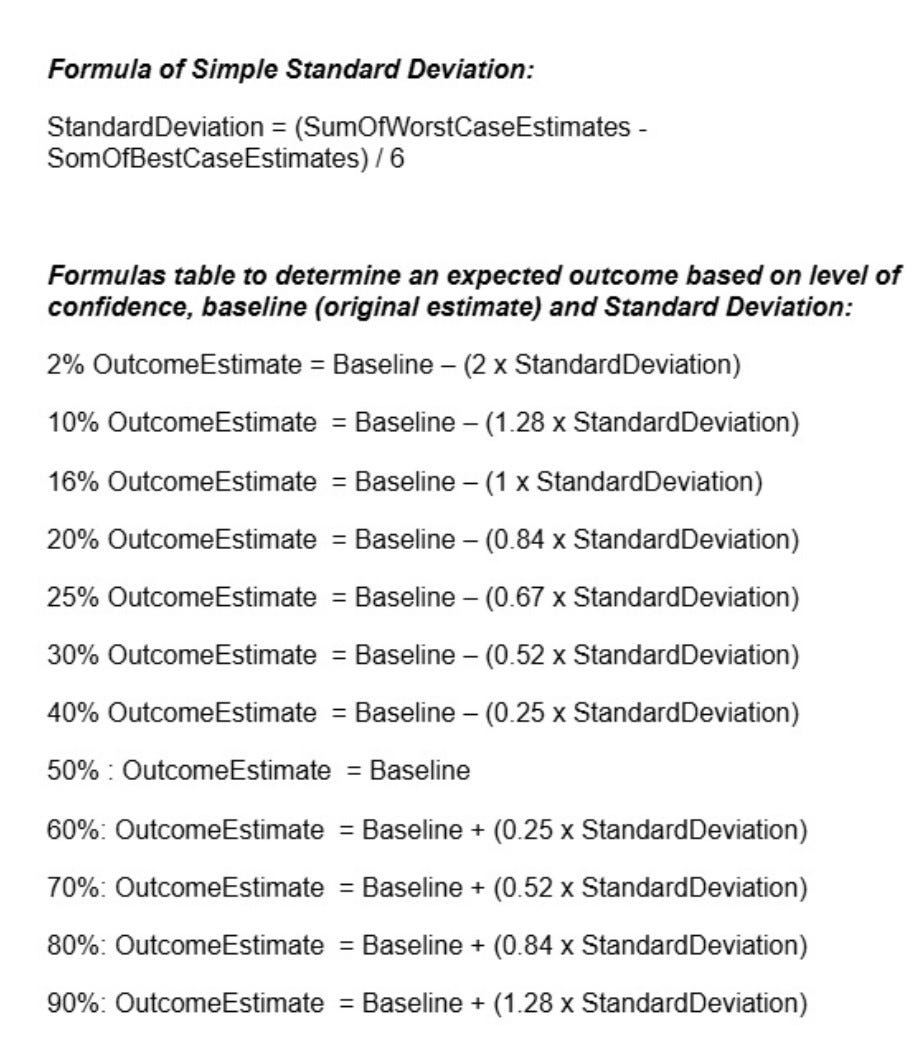
Note: Given formulas are based on prior broad research on IT projects average performance in the industry. They can be helpful in general cases, but can be tweaked based on historical organizational and teams’ performances. These formulas are the simplest ones.
Use these formulas this way:
Take historical value as a baseline
Calculate standard deviation by using low range number as a best case estimate and low range number as best case
Calculate risk-adjusted outcome estimate based on risk appetite correlated with % level of confidence
Example
Let’s assume that our project “Implement a Payment Gateway Solution“ is in the Requirements stage and that the team has provided the following baseline estimates (in days) for the project tasks.
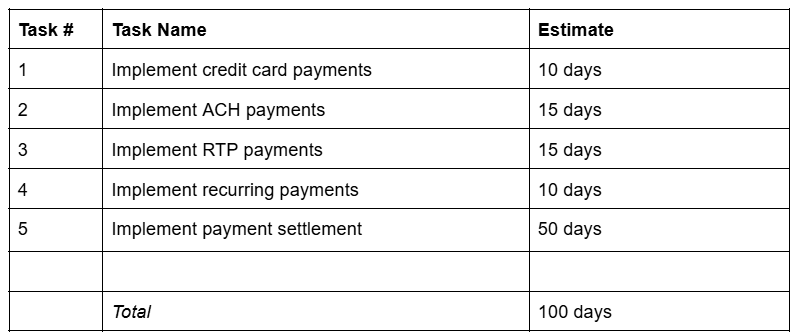
Our goal is to evaluate an outcome estimate based on provided baseline estimates and the confidence level of 80%.
Let’s apply the formulas we defined earlier.
Based on the stage of the project, which is Requirements, we can use the 0.67x for best case multiplier and 1.5x for the worst case multiplier according to the Cone of Uncertainty. Let’s calculate all necessary values for the equation.
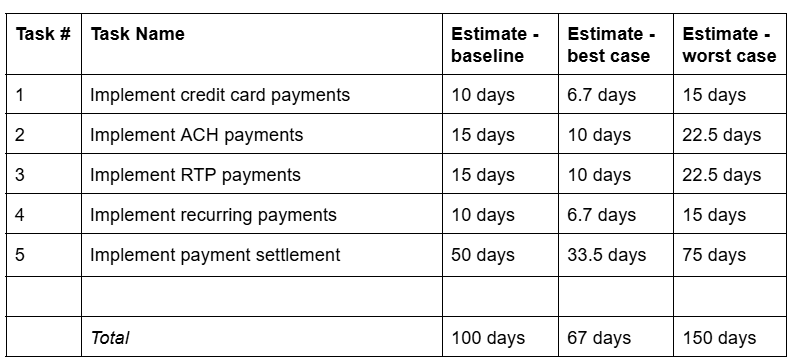
Let’s calculate the standard deviation based on that data:
StandardDeviation = (150 - 67) / 6 = 13.83Based on the confidence level we should select the following formula from the table to calculate the outcome estimate:
80%: Baseline + (0.84 x StandardDeviation)Let’s evaluate that calculation for our case
OutcomeEstimate = 100 + (0.84 x 13.83) = 111 daysWe got 111 days as an outcome estimate with 80% confidence level. Using that estimate will decrease our risks when executing a software development project and will ensure minimum stress on teams and clients with being on track on delivery expectations.
All-In-One Solution for Honest Roadmaps
If you need a complete all-in-one solution to build reliable, evidence-based roadmaps check out the method developed by our team of experts: https://honestroadmaps.com.